“There’s nothing more important than trying to stay home, wash your hands, and get your supplies,” CNBC’s Jim Cramer said.
Predicting Terrorism with Market Intelligence: Stock Options
Jim Rickards explains why there’s a financial crisis coming, and in so doing, reviews the unusual origins of his predictive analytics tool. He also explores complexity theory and Bayesian statistics. Jim Rickards is a renowned author and the chief global strategist at Meraglim. Filmed on July 12, 2018 in New York.
This has roots that go back to 9/11.12:24Tragic day, September 11, 2001, when the 9/11 attack took place.12:31And what happened then– there was insider trading in advance of 9/11.12:37In the two trading days prior to the attack, average daily volume and puts, which is short12:43position, put option buying on American Airlines and United Airlines, was 286 times the average12:50daily volume.12:51Now you don’t have to be an option trader, and I order a cheeseburger for lunch every12:55day, and one day, I order 286 cheeseburgers, something’s up.12:59There’s a crowd here.13:00I was tapped by the CIA, along with others, to take that fact and take it forward.13:06The CIA is not a criminal investigative agency.13:10Leave that to the FBI and the SEC.13:11But what the CIA said was, OK, if there was insider trading ahead of 9/11, if there were13:17going to be another spectacular terrorist attack, something of that magnitude, would13:22there be insider trading again?13:24Could you detect it?13:26Could you trace it to the source, get a FISA warrant, break down the door, stop the attack,13:30and save lives?13:31That was the mission.13:32We call this Project Prophecy.13:34I was the co-project director, along with a couple of other people at the CIA.13:39Worked on this for five years from 2002 to 2007.13:43When I got to the CIA, you ran into some old timers.13:47They would say something like, well, Al-Qaeda or any terrorist group, they would never compromise13:53operational security by doing insider trading in a way that you might be able to find.13:59And I had a two word answer for that, which is, Martha Stewart.14:03Martha Stewart was a legitimate billionaire.14:05She made a billion dollars through creativity and her own company.14:08She ended up behind bars because of a $100,000 trade.14:11My point is, there’s something in human nature that cannot resist betting on a sure thing.14:15And I said, nobody thinks that Mohamed Atta, on his way to Logan Airport, to hijack a plane,14:21stopped at Charles Schwab and bought some options.14:23Nobody thinks that.14:24But even terrorists exist in the social network.14:26There’s a mother, father, sister, brother safe house operator, car driver, cook.14:32Somebody in that social network who knows enough about the attack and they’re like,14:36if I had $5,000, I could make 50, just buy a put option.14:40The crooks and terrorists, they always go to options because they have the most leverage,14:44and the SEC knows where to look.14:47So that’s how it happens.14:49And then the question was, could you detect it.14:52So we started out.14:53There are about 6,000 tickers on the New York Stock Exchange and the NASDAQ.14:57And we’re talking about second by second data for years on 6,000 tickers.15:03That’s an enormous, almost unmanageable amount of data.15:06So what we did is we reduced the targets.15:08We said, well, look, there’s not going to be any impact on Ben and Jerry’s ice cream15:12if there’s a terrorist attack.15:14You’re looking at cruise ships, amusement parks, hotels, landmark buildings.15:18there’s a set of stocks that would be most effective.15:22So we’re able to narrow it down to about 400 tickers, which is much more manageable.15:26Second thing you do, you establish a baseline.15:28Say, what’s the normal volatility, the normal average daily volume, normal correlation in15:35the stock market.15:36So-called beta and so forth.15:37And then you look for abnormalities.15:39So the stock market’s up.15:42The transportation sector is up.15:43Airlines are up, but one airline is down.15:46What’s up with that?15:47So that’s the anomaly you look for.15:48And then the third thing you do.15:49You look for news.15:50Well, OK, the CEO just resigned because of some scandal.15:54OK, got it, that would explain why the stock is down.15:57But when you see the anomalous behavior, and there’s no news, your reference is, somebody16:03knows something I don’t.16:04People aren’t stupid, they’re not crazy.16:06There’s a reason for that, just not public.16:08That’s the red flag.16:09And then you start to, OK, we’re in the target zone.16:12We’re in these 400 stocks most affected.16:15We see this anomalous behavior.16:17Somebody is taking a short position while the market is up and there’s no news.16:21That gets you a red light.16:23And then you drill down.16:24You use what in intelligence work we call all source fusion, and say, well, gee, is16:28there some pocket litter from a prisoner picked up in Pakistan that says cruise ships or something16:34along– you sort of get intelligence from all sources at that point drilled down So16:38that was the project.16:40We built a working model.16:41It worked fine.16:42It actually worked better than we expected.16:44I told the agency, I said, well, we’ll build you a go-kart, but if you want a Rolls Royce,16:48that’s going to be a little more expensive.16:50The go-kart actually worked like a Rolls Royce.16:52Got a direct hit in August 2006.16:55We were getting a flashing red signal on American Airlines three days before MI5 and New Scotland17:04Yard took down that liquid bomb attack that were going to blow up 10 planes in midair17:09with mostly Americans aboard.17:11So it probably would have killed 3,000 Americans on American Airlines and Delta and other flights17:16flying from Heathrow to New York.17:18That plot was taken down.17:20But again, we had that signal based on– and they made hundreds of arrests in this neighborhood17:26in London.17:27So this worked perfectly.17:30Unfortunately, the agency had their own reasons for not taking it forward.17:37They were worried about headline risk, they were worried about political risk.17:41You say, well, we were using all open source information.17:45You can pay the Chicago Mercantile Exchange for data feed to the New York Stock Exchange.17:48This is stuff that anybody can get.17:49You might to pay for it, but you can get it.17:52But the agency was afraid of the New York Times headline, CIA trolls through 401(k)17:58accounts, which we were not doing.18:00It was during the time of waterboarding and all that, and they decided not to pursue the18:06project.18:07So I let it go, there were plenty of other things to do.18:09And then as time went on, a few years later, I ended up in Bahrain at a wargame– financial18:14war game– with a lot of thinkers and subject matter experts from around the world.18:20Ran into a great guy named Kevin Massengill, a former Army Ranger retired Major in the18:27US army, who was working for Raytheon in the area at the time was part of this war game.18:32We were sort of the two American, little more out of the box thinkers, if you want to put18:36it that way.18:38We hit it off and I took talked him through this project I just described.18:42And we said, well look, if the government doesn’t want to do it, why don’t we do it18:45privately?18:46Why don’t we start a company to do this?18:47And that’s exactly what we did.18:49Our company is, as I mentioned, Meraglim.18:51Our website, Meraglim.com, and our product is Raven.18:55So the question is, OK, you had a successful pilot project with the CIA.19:01It worked.19:02By the way, this is a new branch of intelligence in the intelligence.19:06I-N-T, INT, is short for intelligence.19:08And depending on the source, you have SIGINT, which is signal intelligence, you have HUMINT19:14which is human intelligence, and a number of others.19:17We created a new field called MARKINT, which is market intelligence.19:20How can you use market data to predict things that are happening.19:24So this was the origin of it.19:26We privatized it, got some great scientists on board.19:30We’re building this out ourselves.19:31Who partnered with IBM, and IBM’s Watson, which is the greatest, most powerful plain19:38language processor.19:40Watson can read literally millions of pages of documents– 10-Ks, 10-Qs, AKs, speeches,19:47press releases, news reports.19:51More than a million analysts could read on their own, let alone any individual, and process19:57that in plain language.19:58And that’s one of our important technology partners in this.20:02And we have others.20:04What do we actually do?20:07What’s the science behind this.20:09First of all, just spend a minute on what Wall Street does and what most analysts do,20:13because it’s badly flawed.20:15It’s no surprise that– every year, the Fed does a one year forward forecast.20:22So in 2009, they predict 2010.20:24In 2010, they predict 2011.20:27So on.20:28Same thing for the IMF, same thing for Wall Street.20:30They are off by orders of magnitude year after year.20:34I mean, how can you be wrong by a lot eight years in a row, and then have any credibility?20:38And again, the same thing with Wall Street.20:41You see these charts.20:43And the charts show the actual path of interest rates or the actual path of growth.20:48And then along the timeline, which is the x-axis, they’ll show what people were predicting20:52at various times.20:54The predictions are always way off the actual path.20:57There’s actually good social science research that shows that economists do worse than trained21:02monkeys on terms of forecasting.21:04And I don’t say that in a disparaging way– here’s the science.21:07A monkey knows nothing.21:08So if you have a binary outcome– up, down, high, low, growth, recession– and you ask21:17a monkey, they’re going to be right half the time and wrong half the time, because they21:20don’t know what they’re doing.21:21So you’re to get a random outcome.21:24Economists are actually wrong more than half the time for two reasons.21:28One, their models are flawed.21:29Number two, what’s called herding or group behavior.21:32An economist would rather be wrong in the pack than go out on a limb and maybe be right,21:37but if it turns out you’re not right, you’re exposed.21:40But there are institutional constraints.21:42People want to protect their jobs.21:44They’re worried about other things than getting it right.21:47So the forecasting market is pretty bad.21:48The reasons for that– they use equilibrium models.21:52The capital markets are not in equilibrium system, so forget your equal equilibrium model.21:57They use the efficient market hypothesis, which is all the information is out there,22:01you can’t beat the market.22:02Markets are not efficient, we know that.22:05They use stress tests, which are flawed, because they’re based on the past, but we’re outside22:12the past.22:13The future could be extremely different.22:16They look at 9/11, they look at long term capital management, they look at the tequila22:20crisis.22:21Fine, but if the next crisis is worse, there’s nothing in that history that’s going to tell22:25you how bad it can get.22:27And so they assume prices move continuously and smoothly.22:30So price can go from here to here or from here to here.22:34But as a trader, you can get out anywhere in between, and that’s for all these portfolio22:38insurance models and stop losses come from.22:41That’s not how markets behave.22:42That go like this– they just gap up.22:44They don’t hit those in between points.22:45Or they gap down.22:46You’re way underwater, or you missed a profit opportunity before you even knew it.22:51So in other words, the actual behavior of markets is completely at odds with all the22:56models that they use.22:57So it’s no surprise the forecasting is wrong.23:00So what are the good models?23:01What are the models that do work?23:03What is the good science?23:04The first thing is complexity theory.23:07Complexity theory has a long pedigree in physics, meteorology, seismology, forest fire management,23:13traffic, lots of fields where it’s been applied with a lot of success.23:18Capital markets are complex systems.23:20The four hallmarks of a complex system.23:24One is their diversity of actors, sure.23:26Two is their interaction– are the actors talking to each other or are they all sort23:30of in their separate cages.23:31Well, there’s plenty of interaction.23:33Is there communication and is there adaptive behavior?23:37So yeah, there are diverse actors, there’s communication.23:40They’re interacting.23:42And if you’re losing money, you better change your behavior quickly.23:45That’s an example of adaptive behavior.23:47So capital markets are four for four in terms of what makes a complex system.23:51So why not just take complexity science and bring it over to capital markets?23:55That’s what we’ve done, and we’re getting fantastic results.23:57So that’s the first thing.23:58The second thing we use is something called Bayesian statistics.24:03It’s basically a mathematical model that you use when you don’t have enough data.24:08So for example, if I’ve got a million bits of data, yeah, do your correlations and regressions,24:14that’s fine.24:15And I learned this at the CIA, this is the problem we confronted after 9/11.24:19We had one data point– 9/11.24:20Janet Yellen would say, wait for 10 more attacks, and 30,000 dead, and then we’ll have a time24:26series and we can figure this out.24:28No.24:29To paraphrase Don Rumsfeld, you go to war with the data you have.24:33And so what you use is this kind of inferential method.24:37And the reason statisticians dislike it is because you start with a guess.24:41But it could be a smart guess, it could be an informed guess.24:44The data may be scarce.24:45You make the best guess you can.24:47And if you have no information at all, just make it 50/50.24:50Maybe Fed is going to raise rates, maybe they’re not.24:53I think we do better than that on the Fed.24:55But if you didn’t have any information, you just do 50/50.24:58But then what you do is you observe phenomena after the initial hypothesis, and then you25:05update the original hypothesis based on the subsequent data.25:07You ask yourself, OK this thing happened later.25:10What is the conditional correlation that the second thing would happen if the first thing25:14were true or not?25:16And then based on that, you’d go back, and you either increase the probability of the25:19hypothesis being correct, or you decrease it.25:21It gets low enough, you abandon it, try something else.25:24If it gets high enough, now you can be a lot more confident in your prediction.25:27So that’s Bayesian statistic.25:29You use it to find missing aircraft, hunt submarines.25:32It’s used for a lot of things, but you can use it in capital markets.25:36Third thing, behavioral psychology.25:38This has been pretty well vetted.25:40I think most economists are familiar with it, even though they don’t use it very much.25:43But humans turn out to be a bundle of biases.25:48We have anchoring bias, we get an idea in our heads, and we can’t change it.25:52We have recency bias.25:54We tend to be influenced by the last thing we heard.25:57And anchoring bias is the opposite, we tend to be influenced by something we heard a long26:01time ago.26:03Recency bias and anchoring bias are completely different, but they’re both true.26:07This is how you have to get your mind around all these contradictions.26:11But when you work through that, people make mistakes or exhibit bias, it turns out, in26:16very predictable ways.26:18So factor that in.26:19And then the fourth thing we use, and economists really hate this, is history.26:23But history is a very valuable teacher.26:26So those four areas, complexity theory, Bayesian statistics, behavioral psychology, and history26:33are the branches of science that we use.26:35Now what do we do with it?26:37Well, we take it and we put it into something that would look like a pretty normal neural26:41network.26:42You have nodes and edges and some influence in this direction, some have a feedback loop,26:47some influence in another direction, some are influenced by others, et cetera.26:51So for Fed policy for example, you’d set these nodes, and it would include the things I mentioned26:55earlier– inflation, deflation, job creation, economic growth, capacity, what’s going on27:02in Europe, et cetera.27:03Those will be nodes and there will be influences.27:05But then inside the node, that’s the secret sauce.27:08That’s where we have the mathematics, including some of the things I mentioned.27:12But then you say, OK, well, how do you populate these nodes?27:15You’ve got math in there, you’ve got equations, but where’s the news come from?27:19That’s where Watson comes in.27:20Watson’s reading all these records, feeding the nodes, they’re pulsing, they’re putting27:24input.27:25And then we have these actionable cells.27:26So the euro-dollar cross rate, the Yuandollar cross rate, yen, major benchmark, bonds, yields27:36on 10 year treasury notes, bunds, JGBs, et cetera.27:41These are sort of macro indicators, but the major benchmark bond indices, the major currency27:46across rates, the major policy rates, which are the short term central bank rates.27:50And a basket of commodities– oil, gold, and a few others– they are the things we watch.27:55We use these neural networks I described, but they’re not just kind of linear or conventional28:06equilibrium models.28:07They’re based on the science I describe.28:09So all that good science, bringing it to a new field, which is capital markets, using28:13what’s called fuzzy cognition, neural networks, populating with Watson, this is what we do.28:19We’re very excited about it, getting great results.28:21And this is what I use.28:23When I give a speech or write a book or write an article, and I’m making forecast.28:28This is what’s behind it.28:32So we talked earlier about business cycles, recessions, depressions.28:37And that’s conventional economic analysis.28:40My definition of depression is not exactly conventional, but that’s really thinking in28:44terms of growth, trend growth, below trend growth, business cycles, et cetera.28:50Collapse or financial panic is something different.28:52A financial panic is not the same as a recession or a turn in the business cycle.28:57They can go together, but they don’t have to.28:59So let’s talk about financial panics as a separate category away from the business cycle29:04and growth, which we talked about earlier.29:06Our science, the science I use, the science that we use with Raven, at our company, Meraglim,29:12involves complexity theory.29:14Well, complexity theory shows that the worst thing that can happen in a system is an exponential29:21function of scale.29:23Scale is just how big is it.29:24Now you have to talk about your scaling metrics.29:27We’re talking about the gross notional value derivatives.29:28We’re talking about average daily volume on the stock market.29:31We’re talking about debt.29:33We could be talking about all of those things.29:35This is new science, so I think it will be years of empirics to make this more precise.29:39But the theory is good, and you can apply it in a sort of rough and ready way.29:43So you go to Jamie Dimon, and you say, OK, Jamie, you’ve tripled your gross notional29:50value derivatives.29:51You’ve tripled your derivatives book.29:53How much did the risk go up?29:54Well, he would say, not at all, because yeah, gross national value is triple, but who cares?29:59It’s long, short, long, short, long, short, long, short.30:01You net it all down.30:02It’s just a little bit of risk.30:04Risk didn’t go up at all.30:06If you ask my 87-year-old mother, who is not an economist, but she’s a very smart lady,30:10say, hey mom, I tripled the system, how much did the risk go up?30:14She would probably use intuition and say, well, probably triple.30:17Jamie Dimon is wrong, my mother is wrong.30:21It’s not the net, it’s the gross.30:22And it’s not linear, it’s exponential.30:24In other words, if you triple the system, the growth went up by a factor of 10, 50,30:28et cetera.30:29There’s some exponential function associated with that.30:32So people think, well gee, in 2008, we learned our lesson.30:36We’ve got debt under control, we’ve got derivatives under control.30:39No.30:40Debt is much higher.30:41Debt to GDP ratios are much worse.30:44Total notional value, gross notional values of derivatives is much higher.30:47Now people look at the BIS statistics and say, well, the banks, actually, gross national30:52value derivatives has been going down, which it has, but that’s misleading because they’re30:57taking a lot of that, moving it over to clearing houses.30:59So it’s never been on the balance sheet, it’s always been off balance sheet.31:02But even if you use the footnotes, that number has gone down for banks, but that’s only because31:07they’re putting it over clearing houses.31:09Who’s guaranteeing the clearing house?31:10The risk hasn’t gone away, it’s just been moved around.31:12So given those metrics– debt, derivatives, and other indices, concentration, the fact31:21that the five largest banks in America have a higher percentage of total banking assets31:26than they did in 2008, there’s more concentration– that’s another risk factor.31:31Taking that all into account, you can say that the next crisis will be exponentially31:37worse than the last one.31:38That’s an objective statement based on complexity theory.31:41So you either have to believe that we’re never going to have a crisis.31:44Well, you had one in 1987, you had one in 1994, you had one in 1998.31:49You had the dotcom crash in 2000, mortgage crash in 2007, Lehman in 2008.31:55Don’t tell me these things don’t happen.31:56They happen every five, six, seven years.31:59It’s been 10 years since the last one.32:02Doesn’t mean it happens tomorrow, but nobody should be surprised if it does.32:05So the point is this crisis is coming because they always come, and it will be exponentially32:11worse because of the scaling metrics I mentioned.32:14Who’s ready for that?32:15Well, the central banks aren’t ready.32:17In 1998, Wall Street bailed out a hedge fund long term capital.32:23In 2008, the central banks bailed out Wall Street.32:25Lehman– but Morgan Stanley was ready to fail, Goldman was ready to fail, et cetera.32:31In 2018, 2019, sooner than later, who’s going to bail out the central banks?32:35And notice, the problem has never gone away.32:37We just get bigger bailouts at a higher level.32:40What’s bigger than the central banks?32:42Who can bail out the central banks?32:43There’s only one institution, one balance sheet in the world they can do that, which32:46is the IMF.32:48The IMF actually prints their own money.32:51The SDR, special drawing right, SDR is not the out strawberry daiquiri on the rocks,32:55it’s a special drawing right.32:56It’s world money, that’s the easiest way to think about it.32:58They do have a printing press.33:00And so that will be the only source of liquidity in the next crisis, because the central banks,33:07if they don’t normalize before the crisis– and it looks like they won’t be able to, they’re33:11going to run out of runway, and they can expand the balance sheet beyond the small amount33:17because they’ll destroy confidence, where does the liquidity come from?33:20The answer, it comes from the IMF.33:23So that’s the kind of global monetary reset, the GMR, global monetary resety.33:28You hear that expression.33:31There’s something very new that’s just been called to my attention recently, and I’ve33:36done some independent research on it, and it holds up.33:39So let’s see how it goes.33:42But it looks as if the Chinese have pegged gold to the SDR at a rate of 900 SDRs per33:51ounce of gold.33:52This is not the IMF.33:53The IMF is not doing this.33:55The Federal Reserve, the Treasury is not doing it.33:58The ECB is not doing it.33:59If they were, you’d see it.34:00It would show up in the gold holdings.34:02You have to conduct open market operations in gold to do this.34:05But the Chinese appear to be doing it, and it starts October 1, 2016.34:11That was the day the Chinese Yuan joined the SDR.34:15The IMF admitted the Yuan to the group was four, now five currencies that make up the34:21SDR.34:22So almost to the day, when the Yuan got in the SDR, you see this a horizontal trend where34:29first, gold per ounce is trading between 850 and 950 SDRs.34:37And then it gets tighter.34:38Right now, the range is 875 to 925.34:41Again, a lot of good data behind this.34:44So it’s a very good, it’s another predictive indicator.34:47If you see gold around 870 SDRs per ounce, that’s a strong SDR, weak gold.34:54Great time to buy gold, because the Chinese are going to move back up to 900.34:58So that’s an example of science, observation, base and statistics, inference, all the things35:04we talked about that can be used today in a predictive analytic way.35:08A crisis is coming, because they always do.35:10I don’t have a crystal ball, this is plenty of history to back it up.35:13It’ll be exponentially worse.35:15That’s what the science tells us.35:16The central banks will not be prepared, because they haven’t normalized from the last one.35:20You’re going to have to turn to the IMF, and who’s waiting there but China with a big pile35:24of gold.
Defensive Investing & the History of Recession (w/ Victor Sperandeo) | Real Vision Classics
Victor Sperandeo, President & CEO of EAM Partners, sits down with Adam Rodman, founder and portfolio manager at Segra Capital Management, to break down the relationship between shifting political tides and macroeconomic trends. Sperandeo provides his view on the history of recessions in the United States and on the current inflationary environment. Filmed on January 3, 2019 in Dallas.
Corporate Credit, Employment And Recessions – Putting It All Together
Summary
Investment-grade corporate bonds have been a major tailwind to the economic cycle as yields continue to drop.
Treasury bond yields are falling faster than IG spreads are widening, resulting in lower borrowing costs, but a major increase in late 2018 may have triggered a change in employment.
A rise in corporate bond yields impacts cash flows, margins and, eventually, employment decisions.
Corporate bond prices (yields) are a long leading indicator that impacts the economic cycle through changes in corporate capital spending and employment.
The corporate sector is more leveraged than previous economic cycles. A recession can be triggered if the Coronavirus outbreak causes corporate rates to rise, accelerating the decline in employment growth.
I do much more than just articles at EPB Macro Research: Members get access to model portfolios, regular updates, a chat room, and more. Get started today »
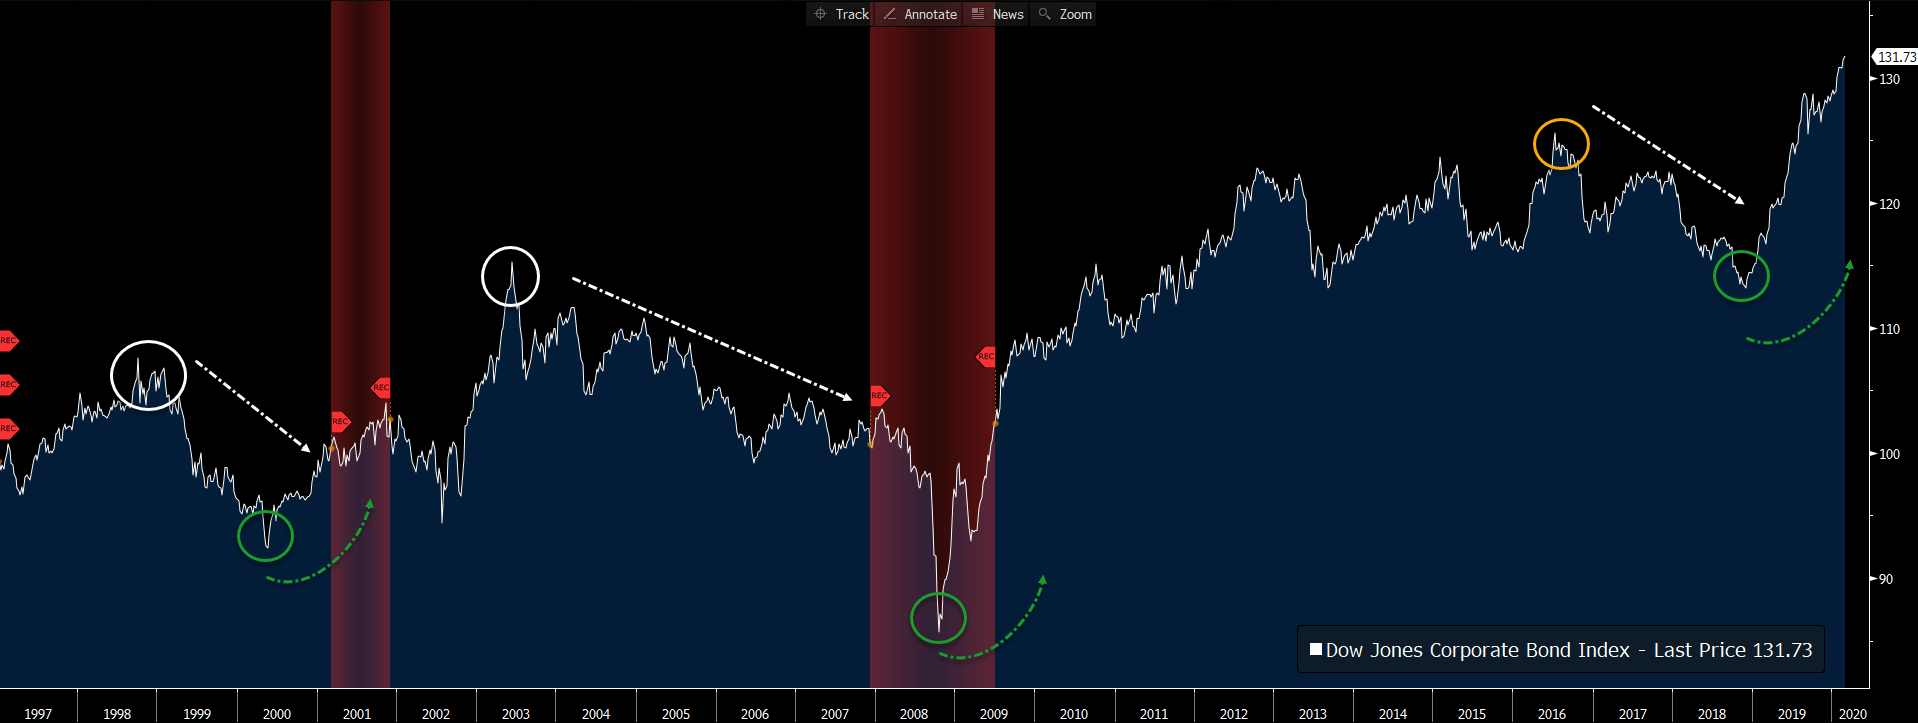
Along with money supply, building permits and corporate margins, corporate bond prices or corporate bond yields fall into the “long leading” indicator bucket, according to “the father of leading indicators,” Geoffrey Moore. Geoffrey Moore’s work found value in using the Dow Jones Corporate Bond Price Index (graphed below), but any measure of corporate bond yields will likely yield similar results. If using bond yields rather than bond prices, the indicator should be inverted as higher corporate bond yields usually translate to lower profit margins and slowing employment growth.
Dow Jones Corporate Bond Price Index:
Source: Bloomberg, EPB Macro Research
As the chart clearly shows, lead times before a recession can be quite long while lead times for recovery are more abrupt. The recovery (or suddenly lower corporate bond yields) has historically been quite helpful in restarting the hiring process and capital spending process.
From an economic cycle sequence perspective, lower bond prices or higher corporate bond yields reduce margins/profitability and have a resulting impact on the rate of capital spending and employment plans. The drop in capex and reduction in employment growth is what ultimately leads to lower income growth, consumption growth, and, eventually, a recession.
In Lacy Hunt’s most recent Quarterly Review and Outlook, he outlined Milton Friedman’s work, which explains that monetary changes (interest rates) and economic cycle impacts typically cluster around two years.
As the research of Nobel Laureate Milton Friedman documented, the typical lags between monetary change and economic fluctuations cluster around two years, confirming the importance of the two-year time frame.
A change in interest rates today may impact future projects. Still, existing investments will likely continue, resulting in a lag between the change in interest rates and the impact on more coincident economic data such as employment.
As a result of this finding, when studying interest rates, it can be valuable to use a 24-month change formula rather than a year-over-year method to more closely capture the two-year cluster.
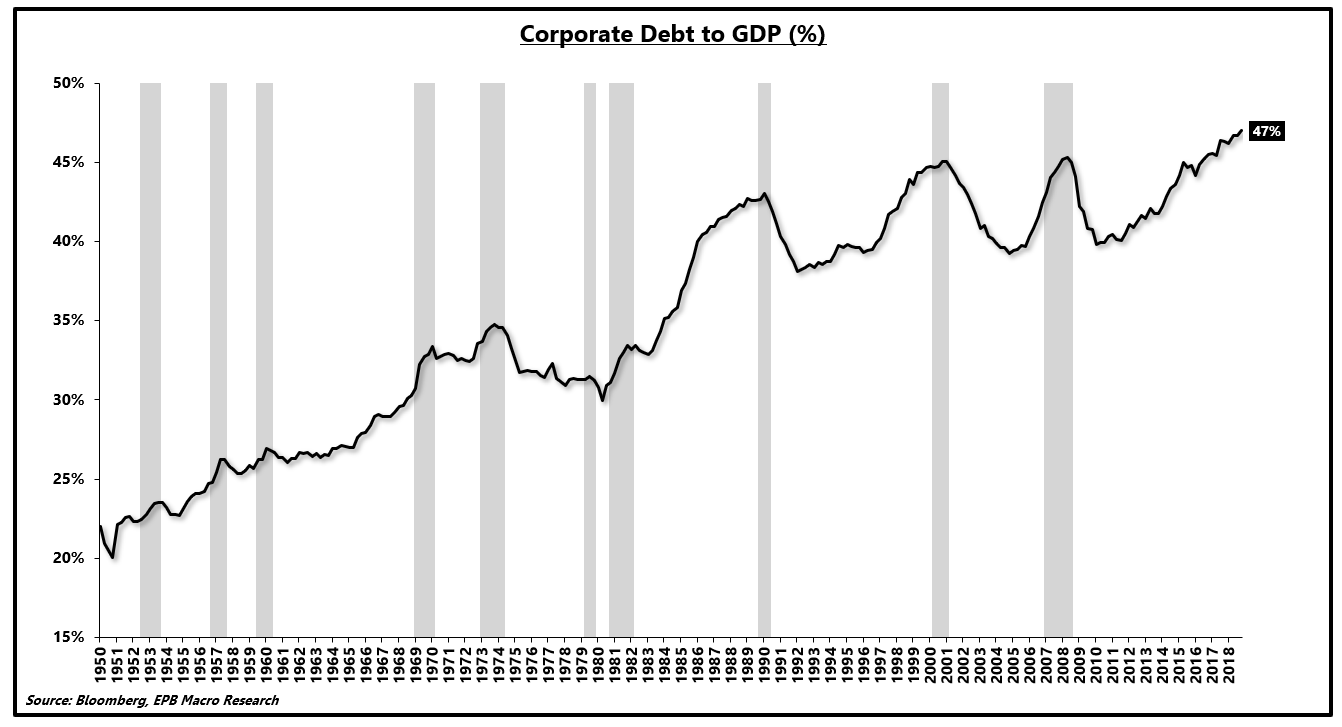
The last point to stress before highlighting some of the more recent trends is that the level of corporate debt is at a record high relative to GDP.
Corporate Debt to GDP Ratio:
Source: Bloomberg, EPB Macro Research
Thus, similar to federal debt, there are diminishing marginal returns or reduced efficacy of each new dollar of debt. More importantly, however, smaller changes in interest rates (corporate bond prices) can have a similar or larger impact on corporate health and the resulting repercussions on overall employment.
Throughout the rest of this note, we will look at the impact of changes in corporate bond prices (yields) and the lagged relationship to employment, as well as some considerations when making a recession forecast.
Currently, corporate bond yields are still falling because Treasury rates are declining faster than spreads are widening. Lower corporate bond yields are helpful on the margin, but the late 2018 spike (two-year cluster) may have been enough to start the process of reduced employment, something very evident in recent data. If the Coronavirus outbreak causes corporate bond yields to rise and accelerates the existing decline in employment growth, a recession is very much in the cards.
Today’s rate of employment growth is insufficient to trigger a recession based on past samples. Still, when an existing downward trend is coupled with a negative shock, recession risk must remain firmly on the table.
US Corporate Sector Health Heading Into 2018
Corporate America has been plagued by anemic economic growth in this economic cycle. Masked by the rising share price of roughly 500 companies, thousands of corporations that aren’t publicly traded have been forced to operate in a low-profit growth regime.
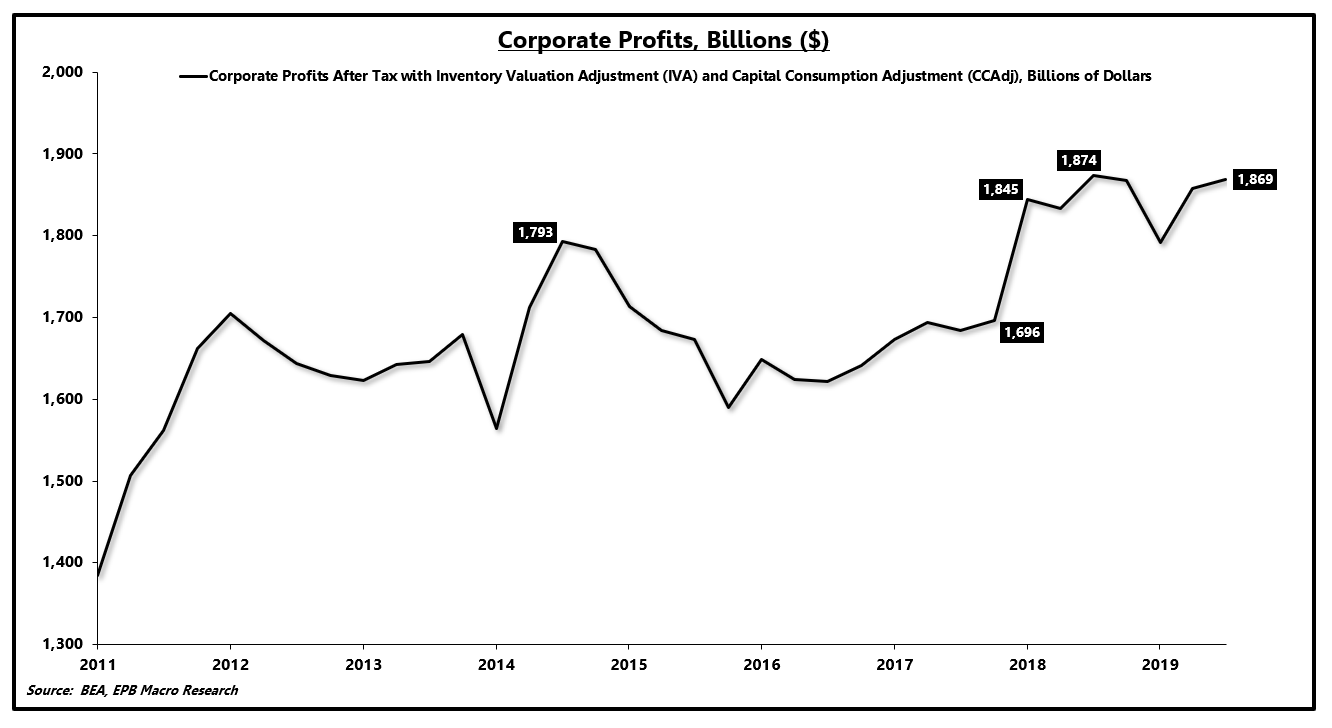
Financial engineering has allowed publicly-traded companies to report strong earnings growth. Total corporate profits reported in the GDP report is a far more accurate, albeit delayed, data source on the real (non-adjusted) profits generated by the corporate sector.
From 2014 through the start of 2018, corporate profits declined. The one-time spike in profits after 2018 was due to the corporate tax cut. Essentially, without the corporate tax cut, the corporate sector has seen virtually no profit growth since 2014.
Corporate Profits:
Source: Bloomberg, EPB Macro Research
On a five-year annualized basis, corporate profits have increased by just 2.2% with the latest year-over-year reading falling 0.3%.
Amazingly, corporate debt has increased, and share prices have soared with very little profit growth, a phenomenon exposed by persistently lower Treasury rates.
Corporate Profits Growth:
Source: Bloomberg, EPB Macro Research
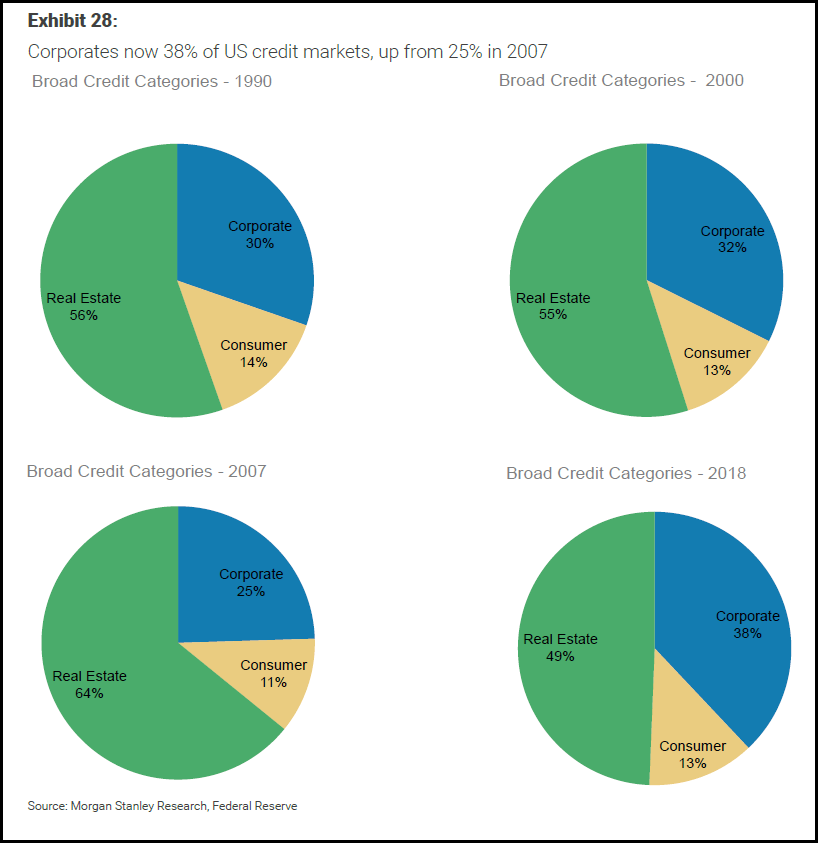
Stacking together real estate debt, corporate debt, and consumer debt shows that the largest increase across economic cycles is coming from the corporate sector.
In the last economic cycle, corporate debt was only 25% of the credit market. In 2018, corporate credit increased to 38% of the total.
Corporate Sector Debt As A % of Total:
Source: Morgan Stanley, EPB Macro Research
As a result of lower profits and more debt, the leverage ratio in corporate America has surged to recessionary levels.
Importantly, the leverage ratio usually increases during a recession as profits (the denominator) fall. Morgan Stanley’s research from 2018 calls out that leverage is at an all-time high in a “healthy economy,” which highlights just how leveraged and sensitive to changes in interest rates the corporate sector has become.
Corporate Sector Leverage:
Source: Morgan Stanley, EPB Macro Research
When corporate borrowing costs rise, employment typically suffers as the increase in interest expense compresses margins.
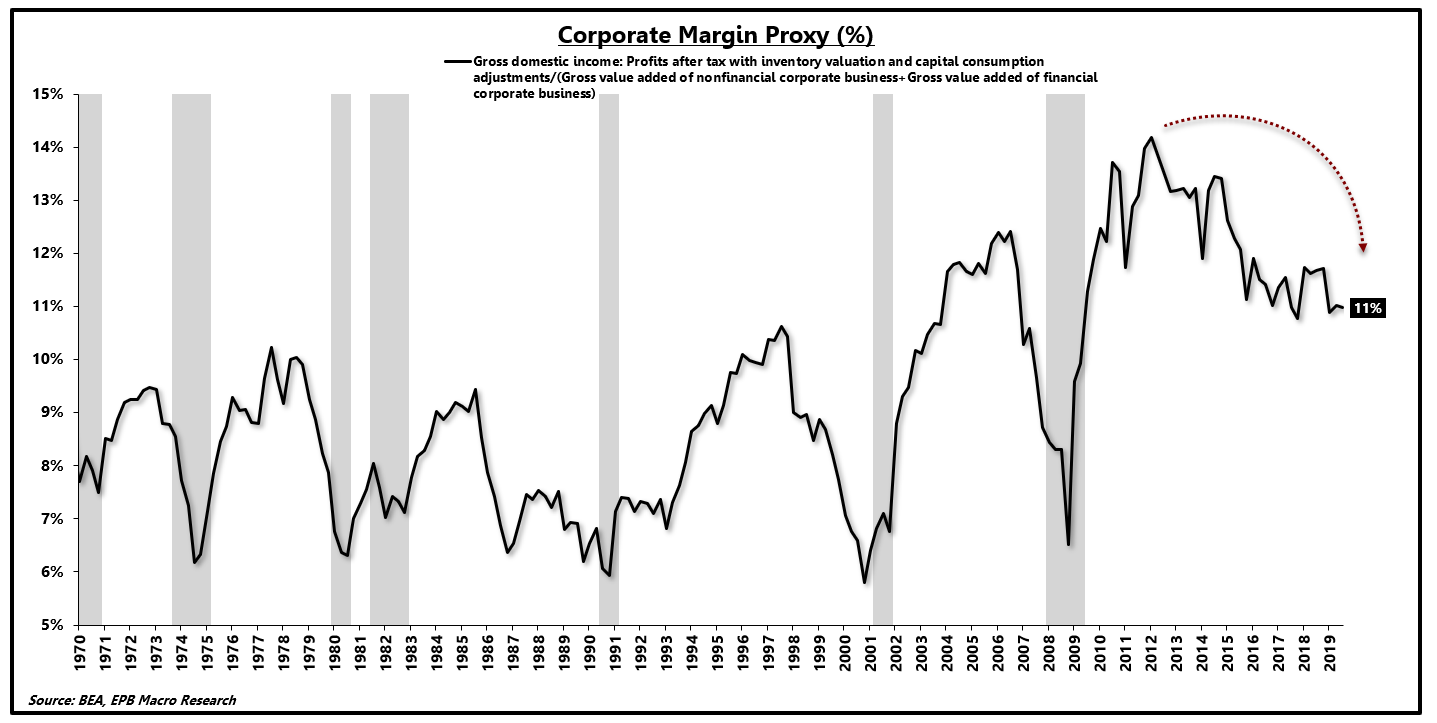
Again, due to weak economic growth and lackluster profit growth across the entire corporate sector, margins (proxied below) have been compressing since the early stages of this economic cycle.
Lower margins foreshadow weaker employment growth and capital spending growth.
Corporate Margins:
Source: Bloomberg, EPB Macro Research
With corporate leverage at extreme levels and corporate margins already in decline, the corporate sector was particularly vulnerable to any spike in corporate borrowing costs as a result of an economic slowdown.
When the Federal Reserve embarked on a monetary tightening cycle, economic conditions globally started to deteriorate with a lag, hitting most economies in 2018 and 2019.
US corporate borrowing costs surged in late 2018 and early 2019, which triggered a more aggressive decline in employment growth and persistent weakness in capital spending growth.
Late 2018 Credit Event – Enough To Trigger A Recession?
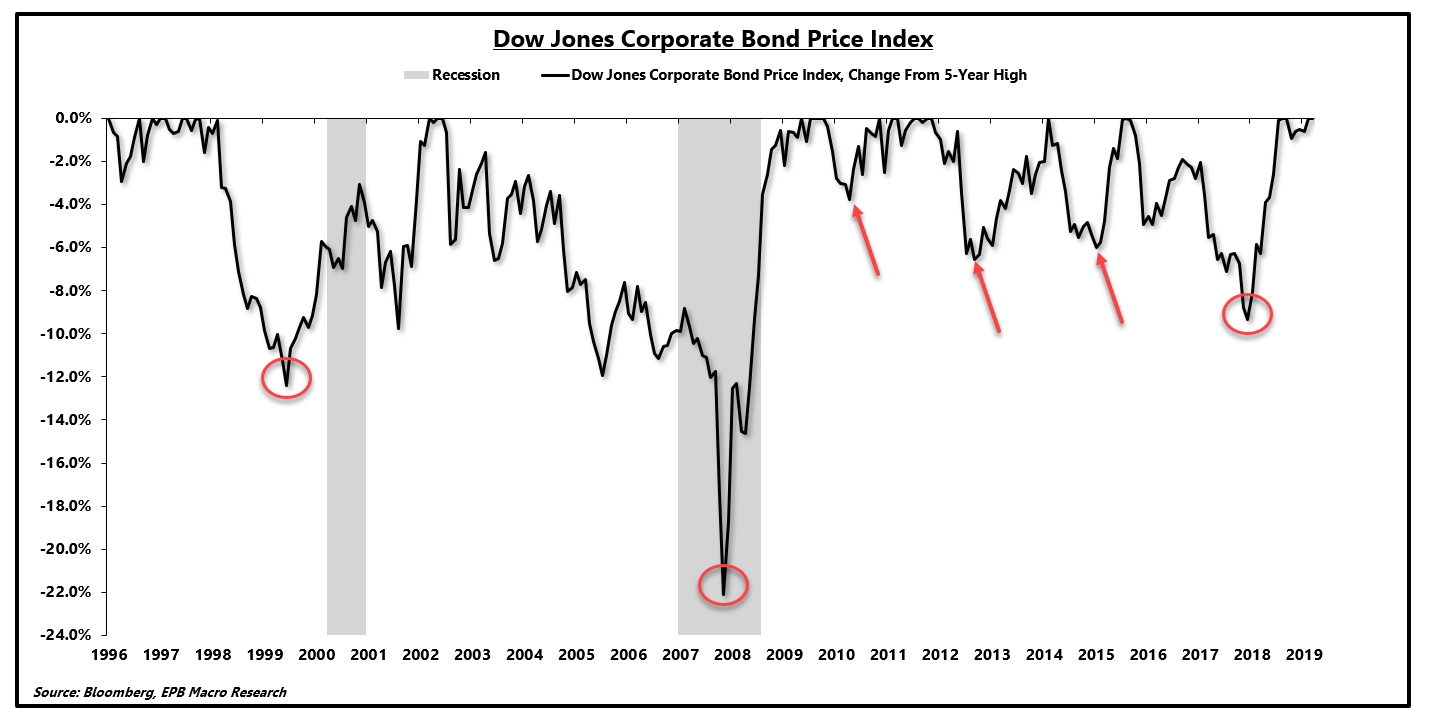
Typically, before recessions, corporate bond prices decline (yields increase) as the Federal Reserve is raising interest rates, and the tighter monetary conditions eventually slow the economy, leading to wider corporate bond spreads.
Corporate bond prices declined three other times this economic cycle, coinciding with the three economic slowdowns before the current downturn.
The 2018 decline in corporate bond prices was larger than the previous three, a sign that economic conditions would weaken. When comparing to the past two recessionary samples, the decline in 2018 was marginally weaker than in 1999. Still, given the leverage ratio and decline in margins, a smaller decline could have a similar impact.
Corporate Bond Prices Tumble:
Source: Bloomberg, EPB Macro Research
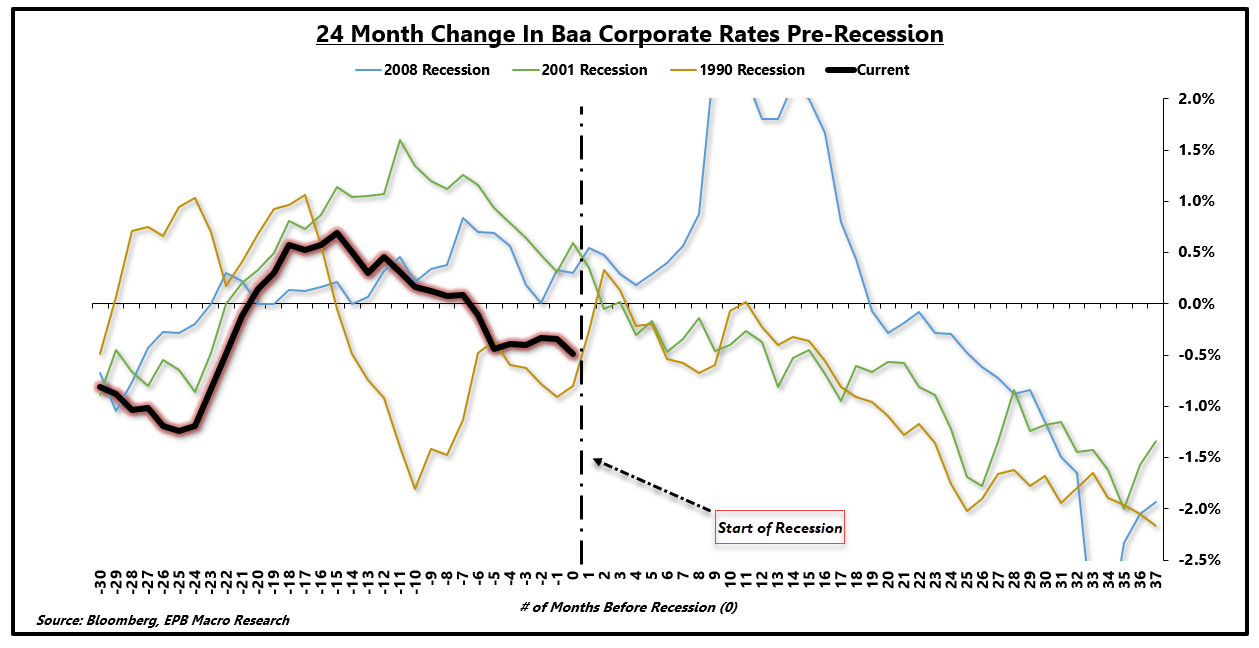
Graphed another way, the chart below shows the 24-month change in Baa corporate bond yields.
The chart is graphed by the number of months before/after a recession with 0 on the x-axis indicating the start of a recession.
The 2018 rise in corporate bond yields was undoubtedly less than the previous three samples, only spending 14 months above 0% on a 24-month change.
Corporate Bond Yield 24-Month Change:
Source: Bloomberg, EPB Macro Research
The corporate sector is far more levered today, with weaker margins and lower trend growth as compared to the prior three recessions.
Thus it remains possible that the decline in corporate bond prices was enough to trigger a downshift in employment growth, an effort to preserve margins.
Impact On The Real Economy
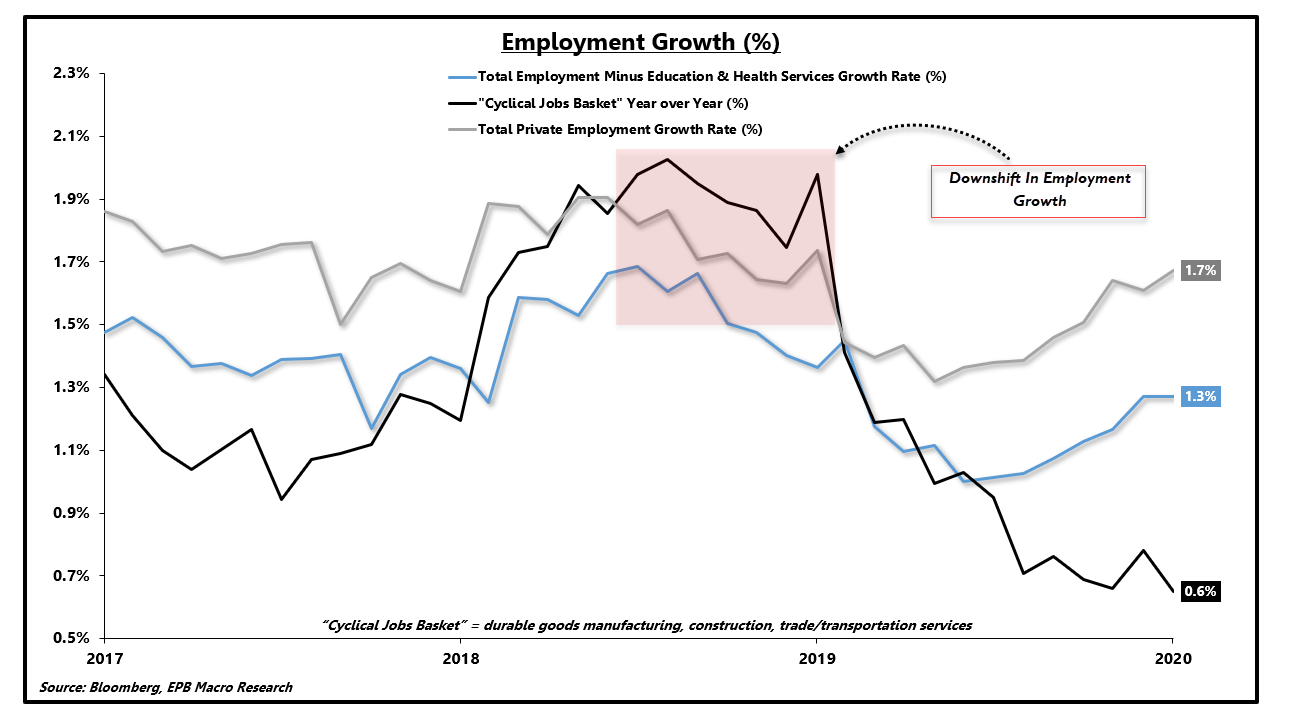
Cycles in employment can be monitored separately from cycles in growth. Geoffrey Moore tracked cycles in growth, inflation, and jobs independently.
Leading indicators of economic growth turned lower very early in 2018, some in late 2017. Inflation indicators did not plunge until September 2018, and jobs growth did not inflect lower until corporate bond yields spiked in late 2018.
Cyclical employment, defined in the chart below as durable goods manufacturing, construction, and trade/transportation services, started to show rapidly-declining rates of growth.
Employment Growth Changed:
Source: Bloomberg, EPB Macro Research
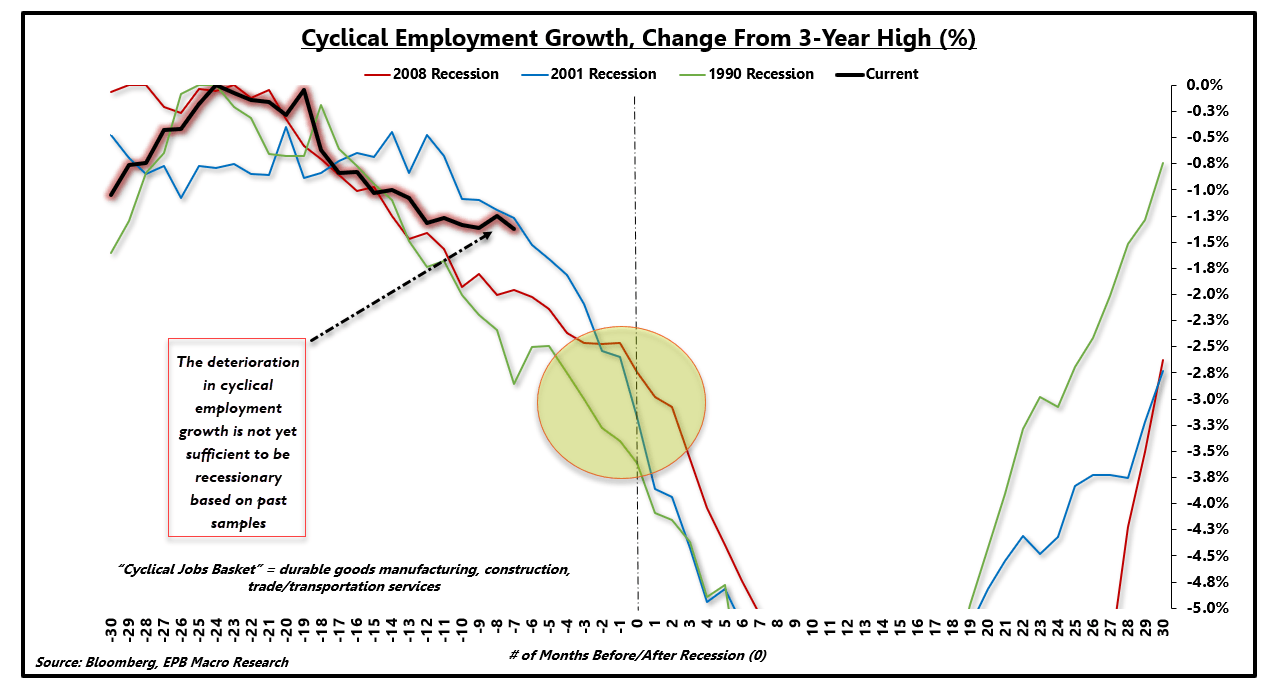
If we track the change in cyclical employment growth before the three previous recessions, we can see recessionary periods begin with similar declines in cyclical employment.
Today’s current track of cyclical employment growth is currently insufficient to be recessionary based on past samples. However, if the trajectory does not flatten or inflect higher, history suggests that income and consumption growth will follow, leading to recessionary conditions.
Employment Growth Trend Relative To Past Samples:
Source: Bloomberg, EPB Macro Research
Employment growth over the next six months remains critical. If corporations continue to post weaker rates of employment growth or accelerate layoffs as a result of the Coronavirus outbreak, a recession is still firmly in play.
An existing trend of weaker growth and employment, originated by the Federal Reserve tightening cycle and deleveraging in China, exposed the economy to a negative shock.
It’s clear using the chart above how a negative shock (COVID-2019) coupled with an existing downturn in growth/employment can create a recession.
The Current Shock
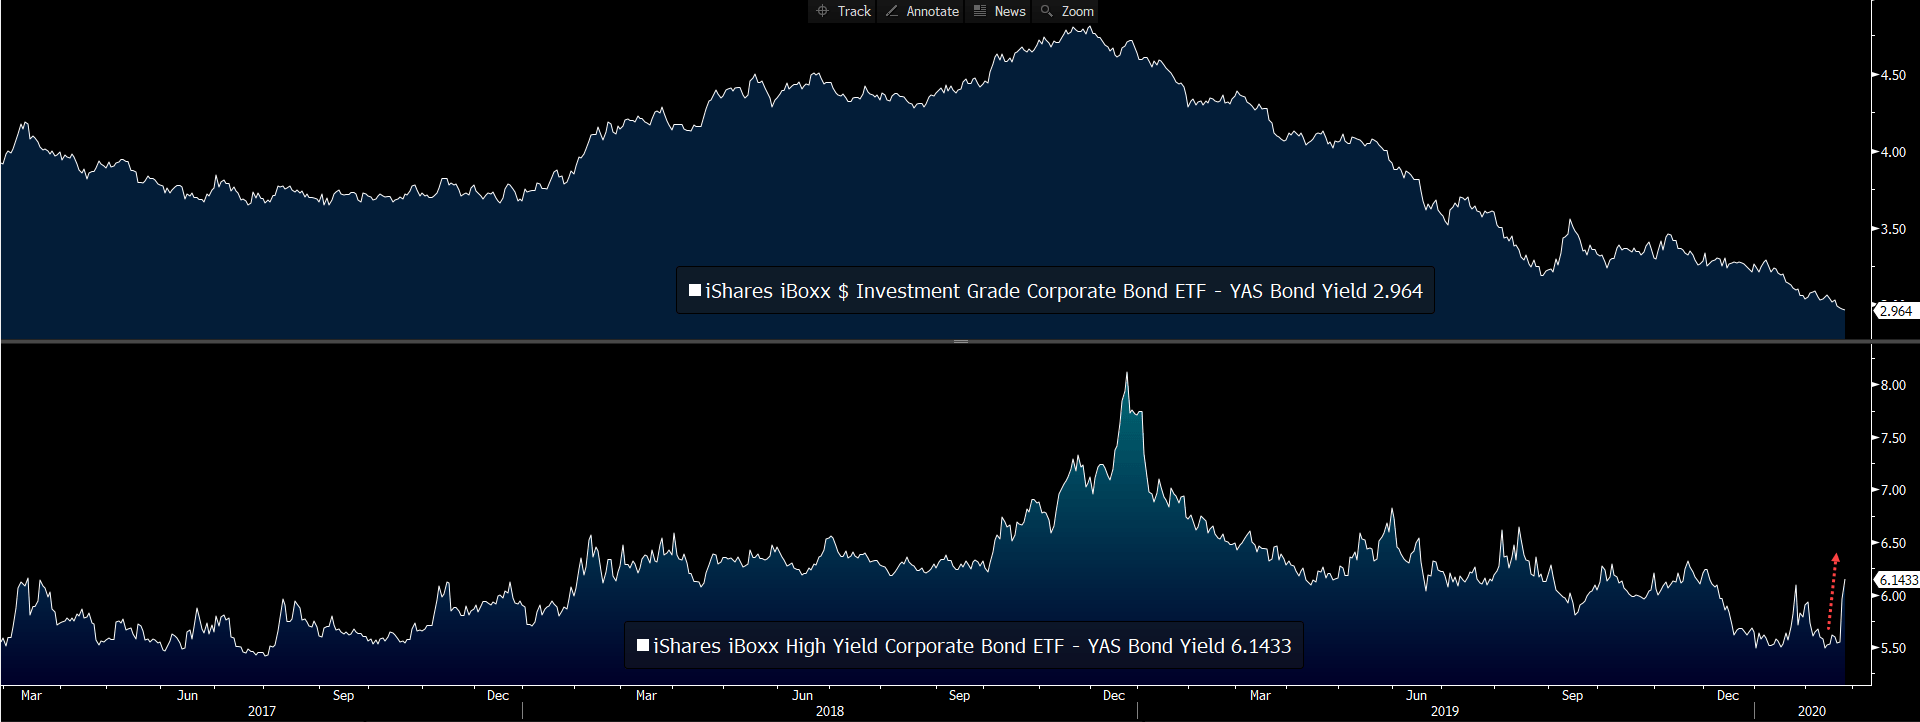
The current economic shock has resulted in a widening of corporate bond spreads. Using popular credit ETFs (LQD) and (HYG), we can track the implied spread above Treasury bonds. Both investment-grade and high-yield credit spreads, particularly high yield, have been widening materially in the past several weeks.
Investment-Grade / High-Yield Corporate Spreads:
Source: Bloomberg, EPB Macro Research
Luckily, however, corporate yields are a function of Treasury rates plus a spread.
For investment-grade bonds, Treasury rates are still declining faster than spreads are increasing, resulting in lower investment-grade bond yields.
High-yield bonds, however, are starting to see higher yields, a firm negative for corporate margins and future employment.
Investment-Grade / High-Yield Corporate Bond Yields:
Source: Bloomberg, EPB Macro Research
The current slowdown in employment growth, specifically cyclical employment growth, is severe and can be seen in many economic data points. If leading indicators of economic growth were turning higher, however, and cyclical employment growth started to increase, the economy may very well avoid a recession.
The negative shock of the Coronavirus has likely caused employment plans to freeze, irrespective of any increase in borrowing costs.
If the Coronavirus continues to cause a sell-off in risk assets and spreads start to widen faster than Treasury rates decline, corporations will be faced with higher borrowing costs at a time when economic growth was on shaky ground to being with.
Employment Growth Trend Relative To Past Samples:
Source: Bloomberg, EPB Macro Research
Should an increase in borrowing costs accelerate the decline in employment growth, and the black line in the chart above drifts into the yellow circle, a recession will be tough to avoid.
Clearly, a call for a recession is premature, and my economic outlook has zero forecasts concerning the virus or any predictions regarding a conclusion.
Rather, when constructing an allocation to weather a shock, we must be mindful of the current state of the economy and the susceptibility to a recession from a negative event.
Currently, a recession is not imminent based on the data above. Still, the situation can evolve quickly, and the economy is far from immune to a shock in its current state.
Keys To Watch and Outlook
The increase in corporate bond yields late in 2018 was small in relation to other recessionary periods. Still, given
- the level of corporate leverage,
- anemic profit growth, and
- weak economic conditions,
a smaller increase can have a more significant impact.
Employment growth has been in a downtrend since that late 2018 period, contributing to weaker rates of consumption growth seen in recent reports.
The economy is not imminently vulnerable to a recession, but that can change in a matter of weeks. The impact on employment is the key to watch when judging lasting recession risk.
Moving forward, if the current shock causes employment growth to suffer, already in a fragile state, recessionary conditions will be tough to avoid.
An acceleration in corporate layoffs will be exacerbated by higher borrowing costs, making credit spreads and bond prices a vital signal.
Given the susceptibility to a recession pending a worsening of conditions, investors should consider an added layer of protection should this negative shock take a turn for the worse.
If conditions worsen or simply do not improve for several weeks, a recession may be difficult to avoid, mainly due to the initial conditions before the shock began.
If the economy does tumble into a recession, risk assets are highly exposed, and a continued overweight allocation to Treasury bonds and gold will likely offer the best protection.
The model portfolio at EPB Macro Research continues to have an overweight exposure to Treasury bonds and gold.