Summary
- The stock market has been set up for a brutal fall for months now.
- Valuations are stretched, revenue already was flat and economic indicators are past peak, heading the wrong way.
- The central banks already are firing bazookas and seeing diminishing marginal impact.
- If the stock market doesn’t hold support around 3000 on the S&P 500, we could see a retest of the December 2018 lows.
- If the stock market does hold support, then you will want to look to sell into any rallies before it turns more decidedly down.
- This idea was discussed in more depth with members of my private investing community, Margin of Safety Investing. Get started today »
In my annual outlook for 2020, I tried to warn people that the stock market was on thin ice. Risk management also has been my refrain for months on my weekly “Investing 2020s” webinars.
In my outlook, I suggested an early year “volatility event” would cause a small correction. It didn’t matter what the volatility was. The market has been looking for a reason to lower valuations.
On Jan. 23, I stated on my Twitter feed that Coronavirus “is actually the most important story in the world…” The Coronavirus COVID-19 outbreak has become the volatility event that’s driving a necessary stock market correction.
For many investors, the urge is to buy the dip here. That’s a bad idea. The stock market has a long way to fall sometime this year.
A better strategy is to reassess you risk tolerance and accept that valuations matter. Ultimately, you should be selling the rips on the very disrupted S&P 500 ETFs (SPY) (VOO), or rallies, in an attempt to bring your cash levels up temporarily. You will get opportunities to buy back into equities at lower valuations in coming quarters.
High Valuations At Low Interest Rates Are A Warning
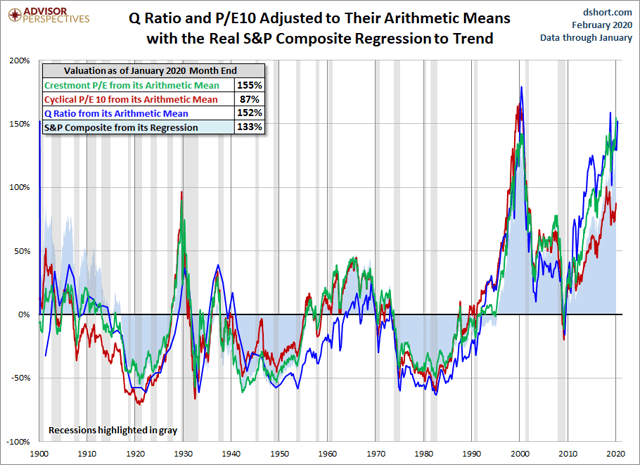
I have covered for members of Margin of Safety Investing for months now that stock market valuations are very high. A single-digit percentage stock market correction has not changed that.
An argument is made that because interest rates are low, the stock market can sustain higher valuations. I would agree that is true, however, to what degree should be asked. Should the stock market be the third most highly valued in history?
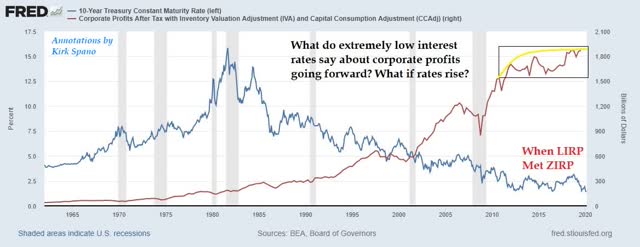
The chart above shows that despite low interest rates heading towards zero, corporate profits haven’t been growing much the past several years. What we have with low interest rates is a period of diminishing marginal returns.
Given that the stock market is a forward looking projector, what happens when lower interest rates or monetary stimulus cannot push corporate profits higher? What happens when businesses simply cannot borrow more for almost free to improve profitability via production or share buybacks? Clearly that challenge already is manifesting.
Q Ratio and Creative Destruction
If you believe that a stock represents the value of an underlying business, I point you to the Q Ratio. That’s total market cap divided by its replacement cost. Essentially, if you are a business person, here’s when you ask: Should I make an investment in the stock of a business or should I simply start a competing business?
The obvious answer for a business person seeing these valuations is to start a business and compete, rather than buy highly-priced stock. What do we know happens when more competition is introduced to a market? Prices fall.
I understand this is a simplistic way of looking at this. We are not going to see thousands of new businesses sprout up to compete, but we are seeing some. And these new businesses are in fact disruptive of many of the older businesses.
Consider the concepts of creative destruction. Think about the unicorns and all the disruption industries are seeing from tech innovation. At some level, perhaps how entrepreneurs get financing, high valuations are in fact encouraging competition to established players already in the market. That can’t be good for many companies or their stock prices.
As Stanley Druckenmiller said a while back: “Buy the disruptors, sell the disrupted.” We’ll come back to this thought below.
The Buffett Indicator
Now that everybody has gotten a chance to read Warren Buffett’s annual letter, let’s take a look at his favorite valuation metric for the broader stock market: The ratio of total market cap and U.S. GDP.
Mislinski with Spano annotations
In that chart I stake out the “old normal” for valuations and a hypothetical “new normal” based on lower interest rates and looser monetary policy. In either reality, the stock market has a long way to fall. I would suggest that we should consider it might fall to the place where the old and new normals overlap. That would imply a 30%-40% stock market correction is on the horizon.
What The Shiller PE Ratio Really Tells You
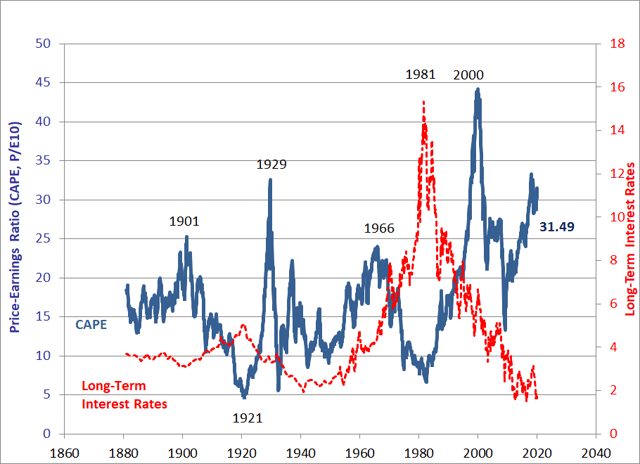
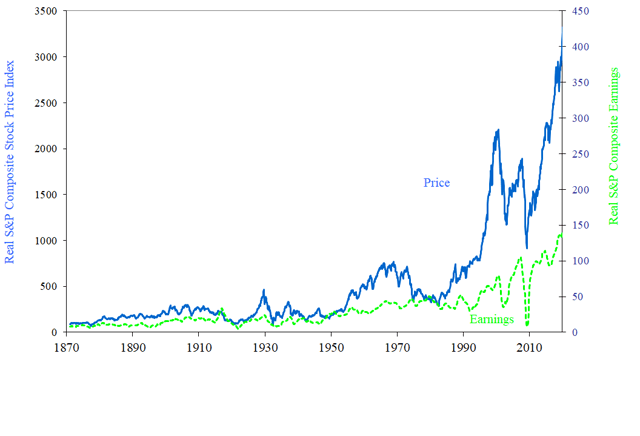
Many people criticize the Shiller PE ratio as unimportant or wrong. That’s a juvenile misunderstanding of what the ratio is. It’s not a short-term oscillator or predictor of imminent stock market movements. Rather, it’s an indicator of expected stock market returns on a normalized basis over the next 10 years based on the last 10 years earnings.
Because earnings move in cycles spanning rather long time frames, the Shiller PE ratio, though imperfect, is a good predictor of whether to expect big, small or middling stock market returns in the next decade.
Robert Shiller Data Yale University
It’s not hard to see that investing during periods of low Shiller PE yielded better long-term returns than investing during periods of higher valuations.
Shiller also overlays interest rates and earnings. The patterns should give us pause. Return to the question I asked above: What if interest rates rise?
There’s at least two very plausible scenarios over the next 10 years that make rising or higher interest rates a strong possibility: Modern monetary theory or helicopter money – more on these soon.
What the Shiller PE really is telling people today is that the 2020s will be more like the 2000s than the 2010s.
SPY Quick Technicals
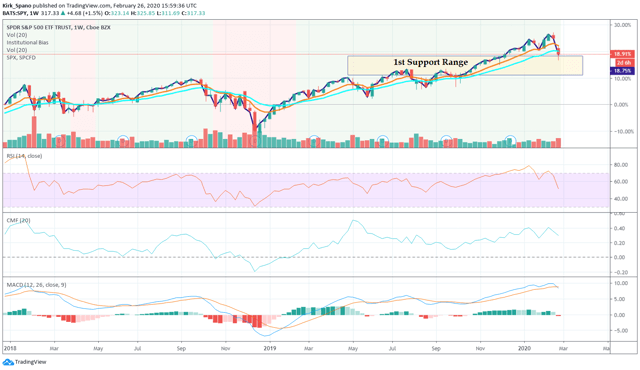
Currently, the S&P 500 is a bit oversold and running into minor support levels. This could cause a slight relief rally.
You will notice I’m using a weekly chart. Why not daily? Simply put, I’m not a day trader, I’m more concerned with bigger market moves over longer time horizons. The weekly charts help me get the intermediate term time frame (six months to two years) better in hand.
On the daily chart (not shown here) that most default to, the RSI is showing an oversold signal. On the weekly however, we can see that the S&P 500 has quite a bit of selling left to it before it’s truly oversold.
We also see that money flows, as measured by Chaikin Money Flow, can fall quite a bit further as well. Look to the fourth quarter of 2018 for a hint as to what might be on the horizon.
Finally, MACD, a measure of momentum, is indicating a longer-term downturn as it crosses over on the weekly time frame.
In February 2018, I covered How Low Can The Stock Market Go and about nailed it. The same story is playing out now, in my opinion. I believe the December 2018 lows are in play for later this year, possibly lower.
Stop Buying The Dips, Sell The Rips
Buying the relatively small dips is no longer a viable strategy through the next significant stock market correction. Instead, investors with a forward outlook and some sense of valuation reality will sell the rips in the short term, then wait to buy the big dips.
I believe that two or three times this coming decade we will see corrections of larger scale. In the short term, Coronavirus may have triggered a slight acceleration and potential deepening of what already was coming to a market near you soon. The economic impact is real and it could expand greatly. We simply do not know yet.
Also, don’t discount the impact of the coming election. At a minimum, it presents a case for uncertainty. Markets do not like uncertainty. Corporations already have slowed down capital investment which is not a good sign.
What if President Trump loses? The richest investors will want to lock in lower capital gains tax rates on highly-appreciated assets by year-end. That could perpetuate a late 2018 style sell-off.
The bottom line is to sell the S&P 500 indexes, which are full of disrupted companies to begin with, on any rips. Then, wait to make new investments later, at lower valuations, in the companies and industries that are disrupting the economy and showing real growth.
We believe the 2020s are going to be more volatile than the easy money inspired 2010s. We also believe that many companies and industries will be significantly impacted by disruptive technology.
With that in mind, we offer to help you build a margin of safety, while taking part in the opportunities that are emerging. Join me, Kirk Spano, and our other top ranked MoSI analysts for deep research and a 4-step approach to finding great growth and dividend investments.
