It is hard to represent our spherical world on flat piece of paper. Cartographers use something called a “projection” to morph the globe into 2D map. The most popular of these is the Mercator projection.
Every map projection introduces distortion, and each has its own set of problems. One of the most common criticisms of the Mercator map is that it exaggerates the size of countries nearer the poles (US, Russia, Europe), while downplaying the size of those near the equator (the African Continent). On the Mercator projection Greenland appears to be roughly the same size as Africa. In reality, Greenland is 0.8 million sq. miles and Africa is 11.6 million sq. miles, nearly 14 and a half times larger.
This app was created by James Talmage and Damon Maneice. It was inspired by an episode of The West Wing and an infographic by Kai Krause entitled “The True Size of Africa“. We hope teachers will use it to show their students just how big the world actually is.
Contact us at thetruesize at gmail dot com
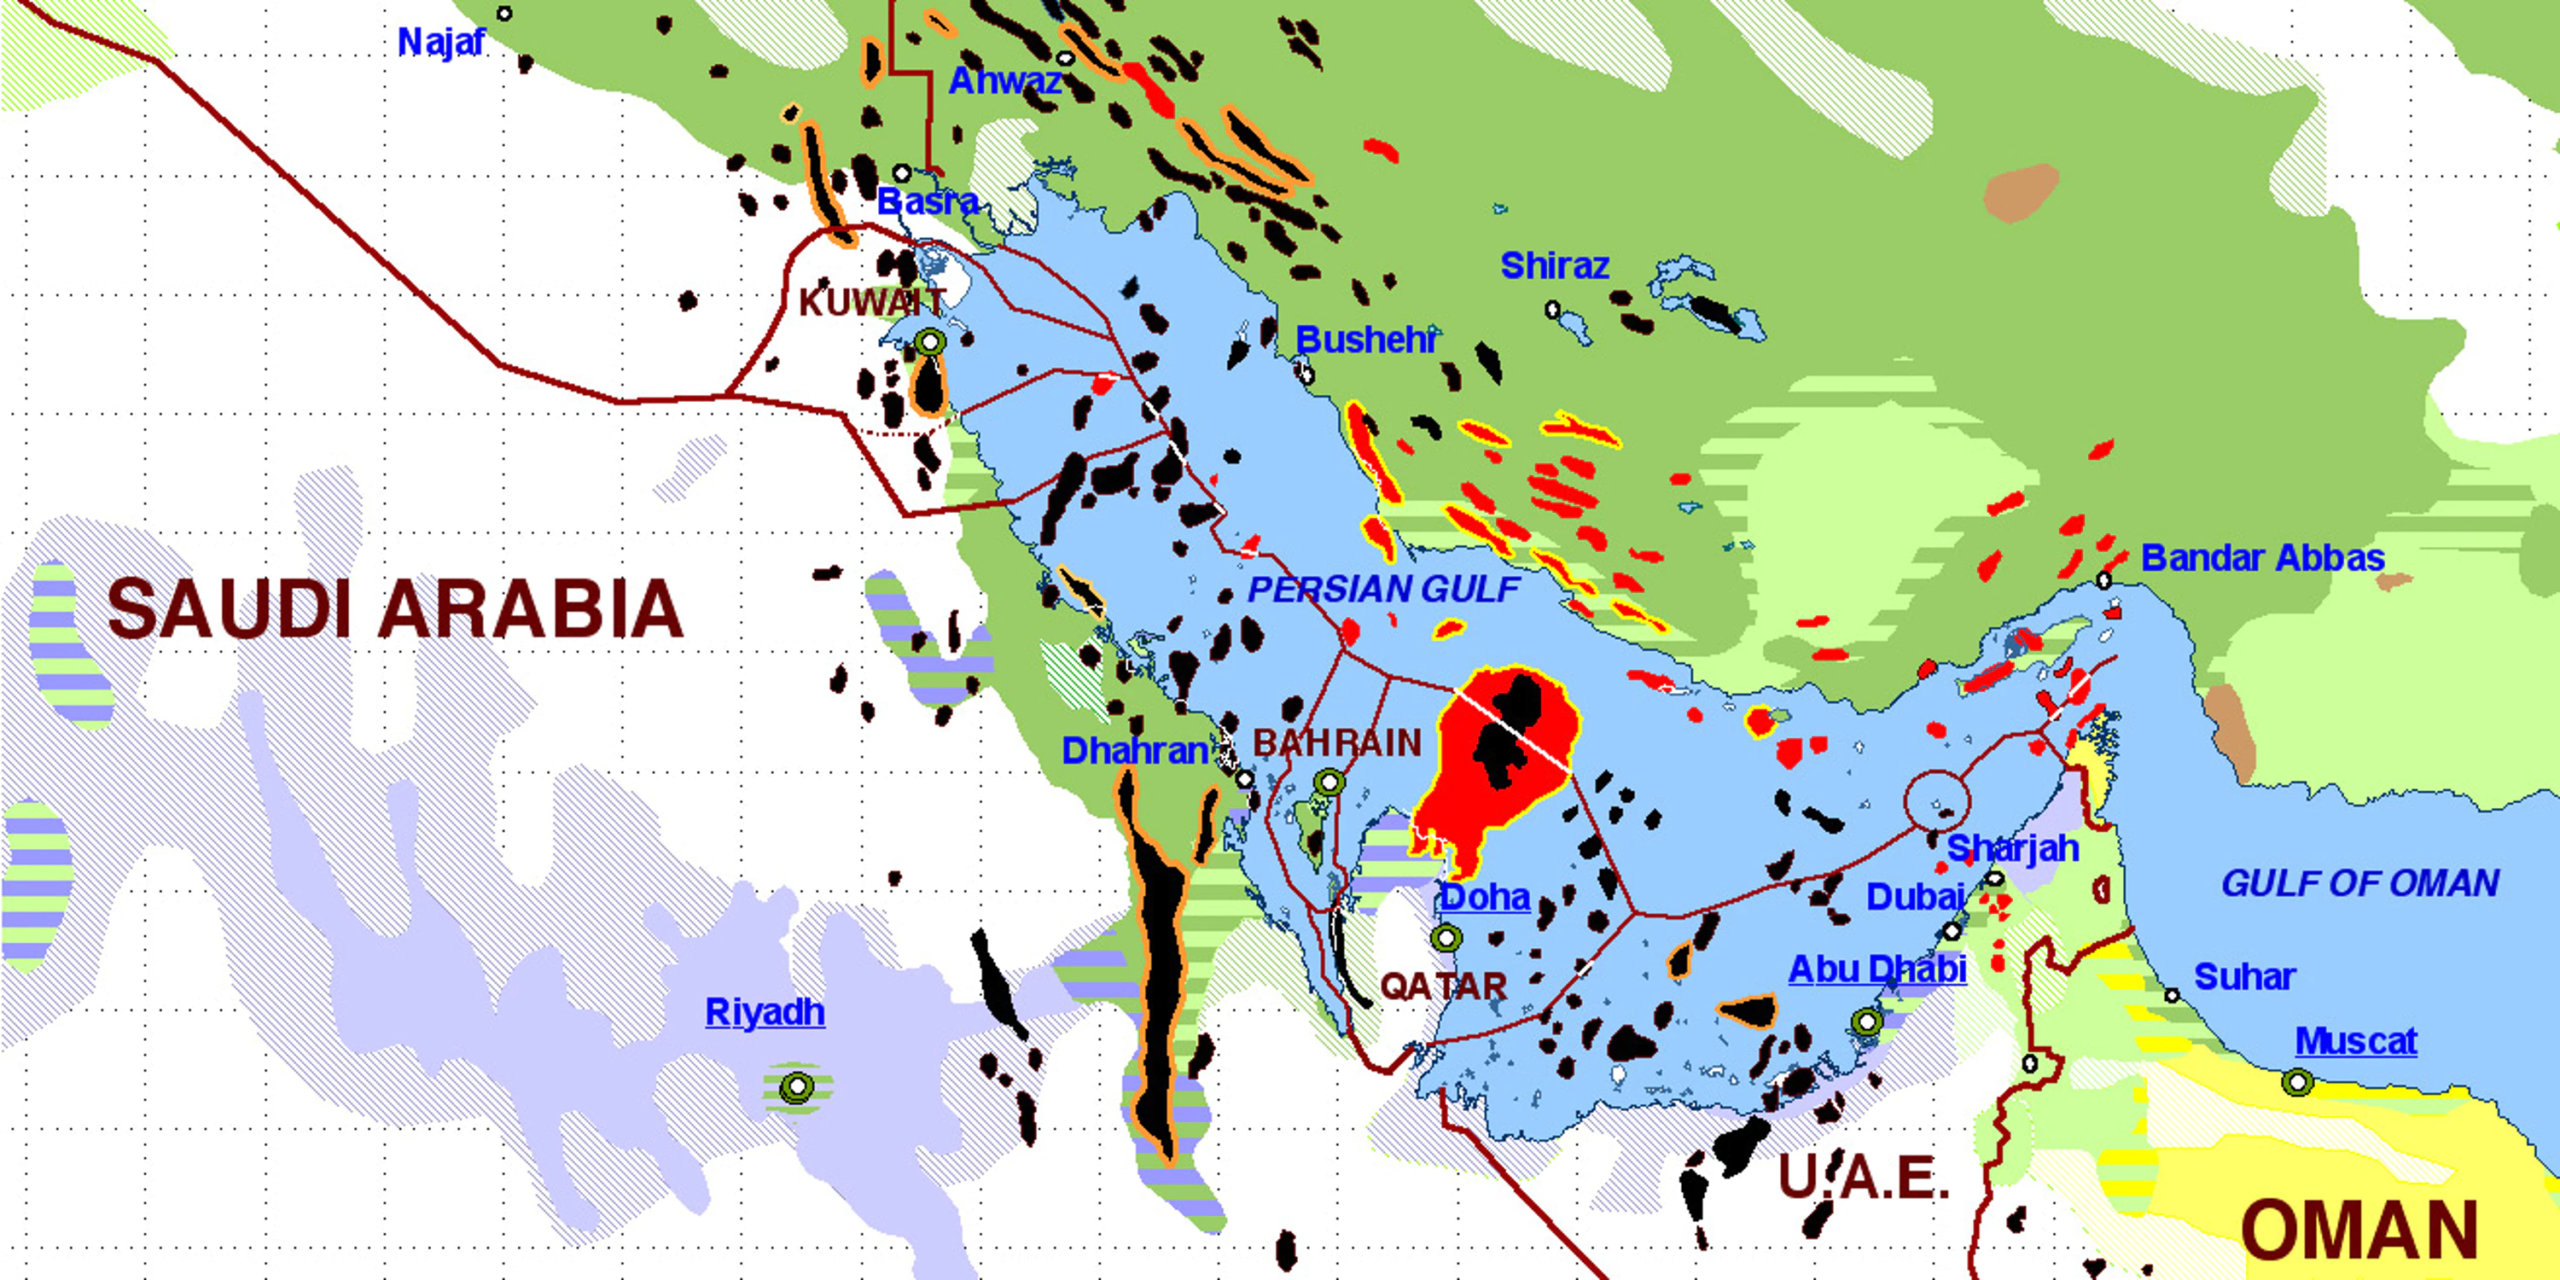
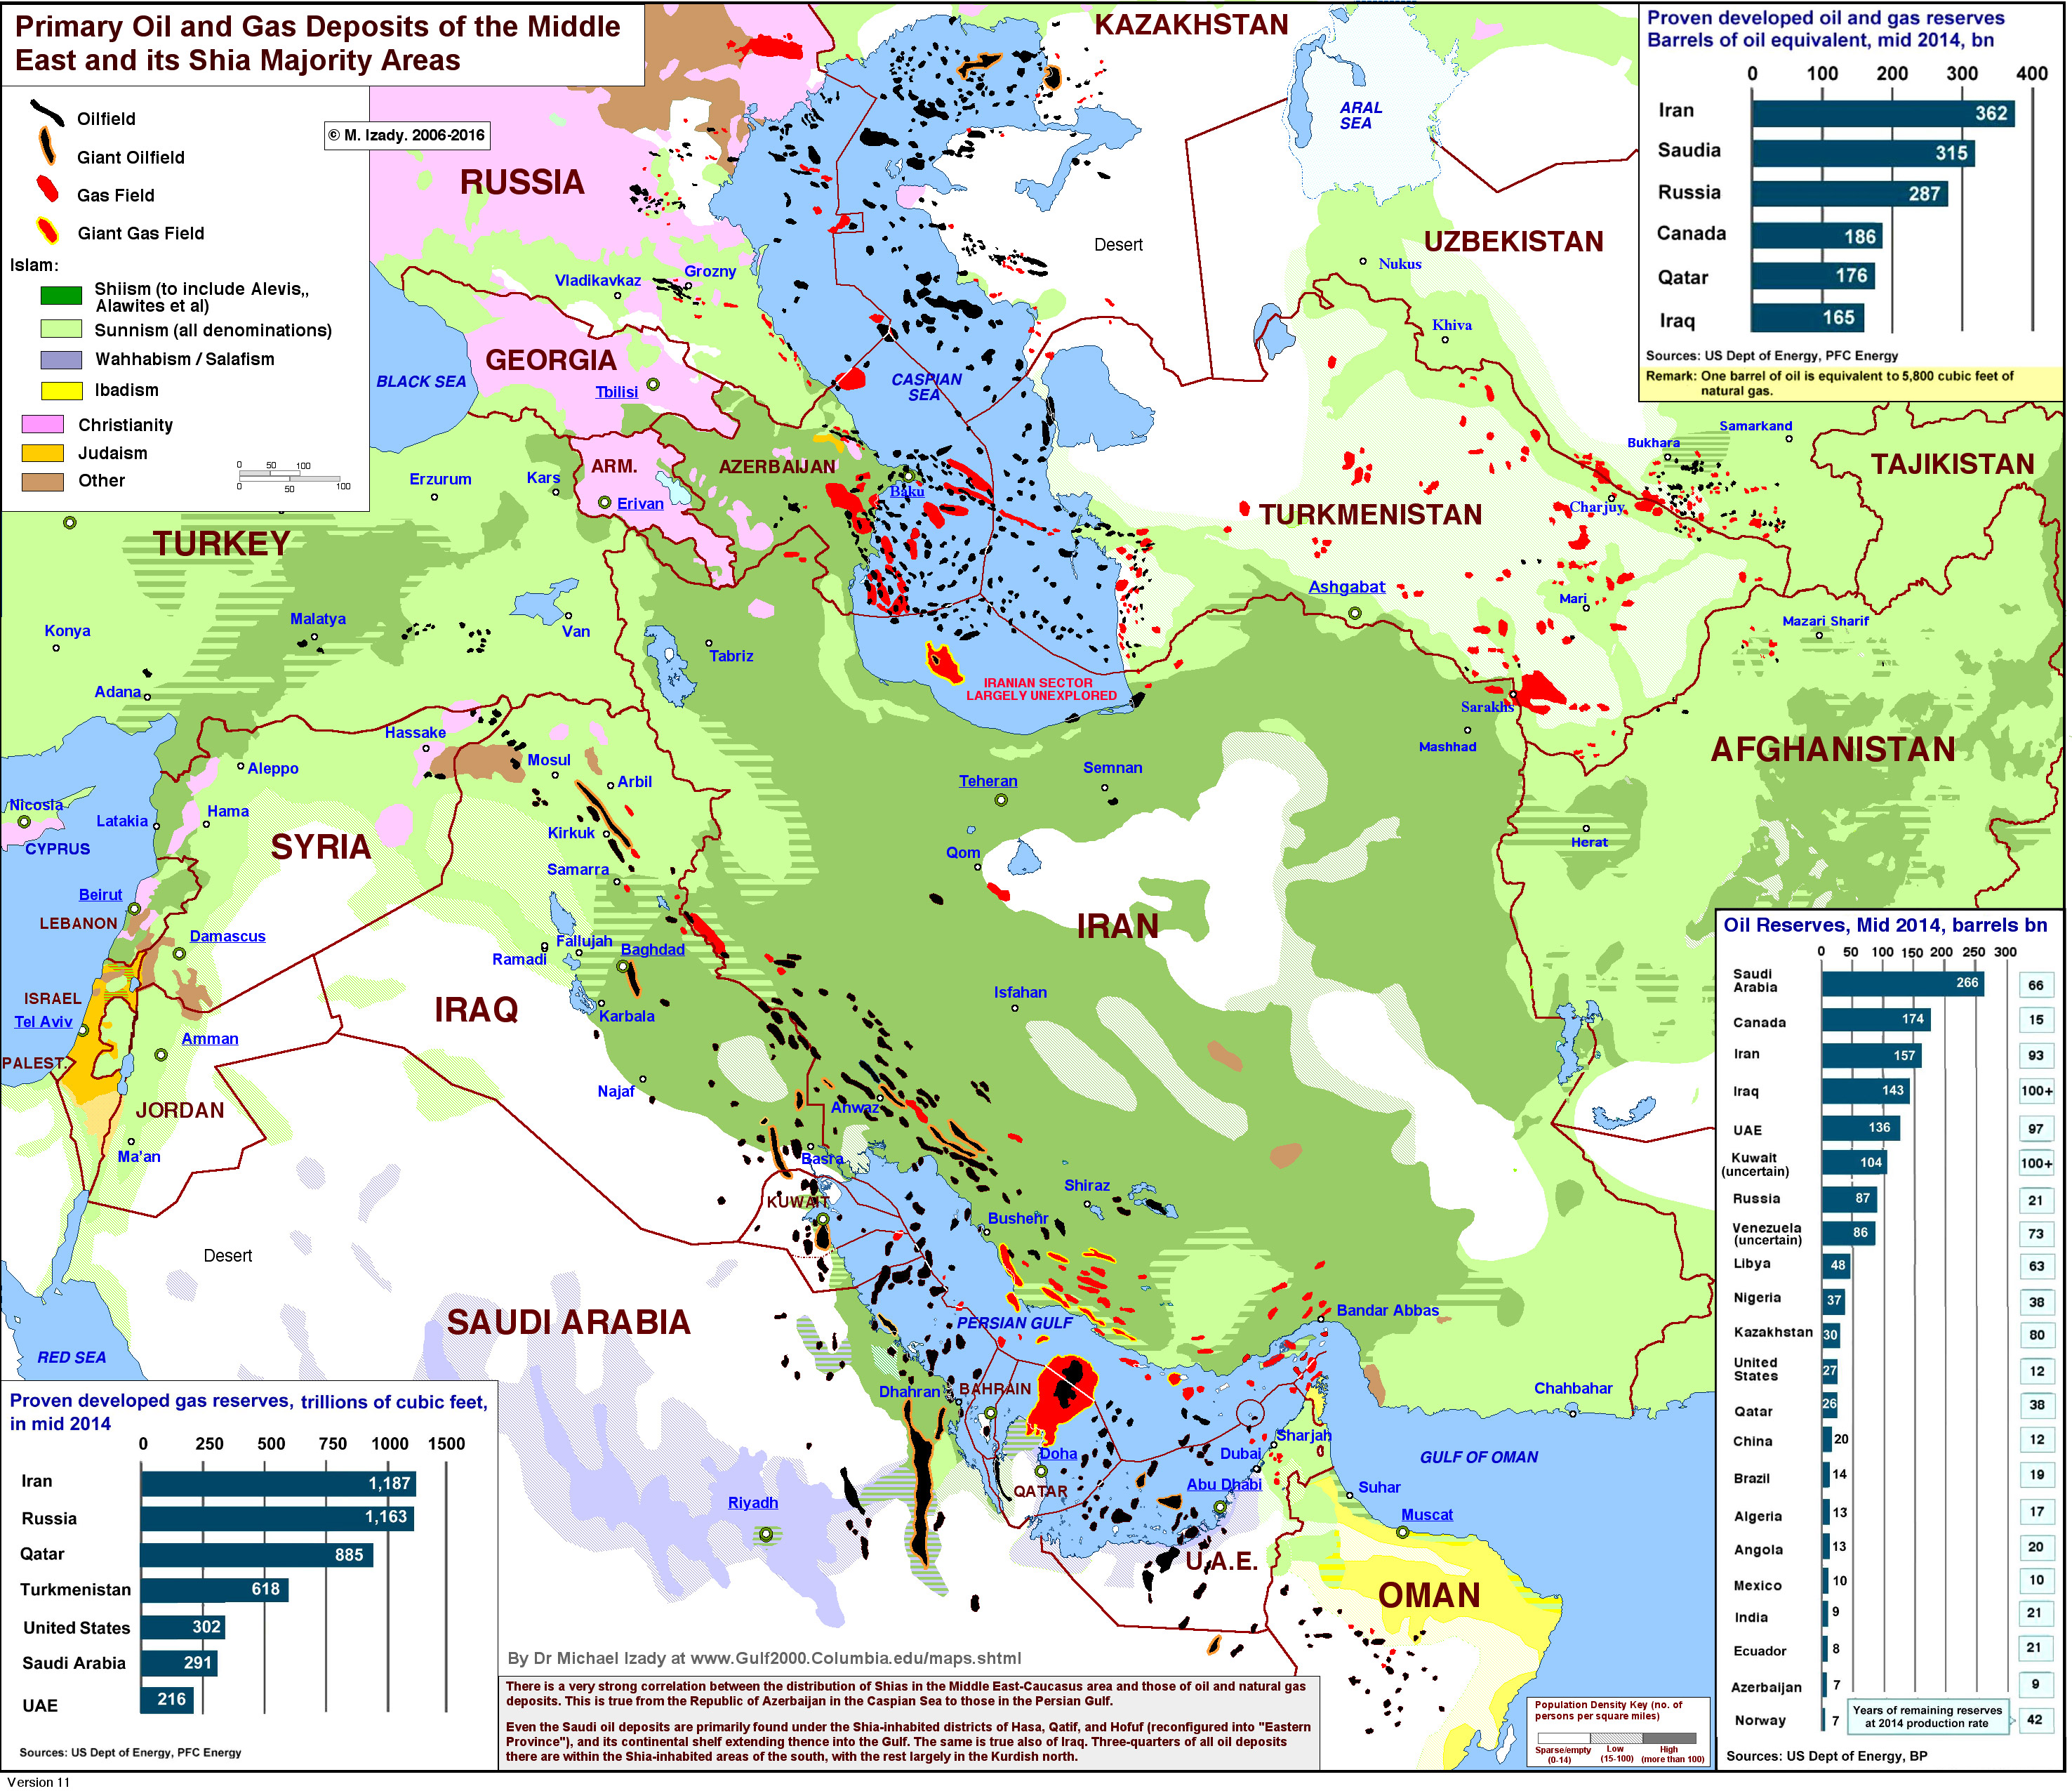
One Map That Explains the Dangerous Saudi-Iranian Conflict
What the map shows is that, due to a peculiar correlation of religious history and anaerobic decomposition of plankton, almost all the Persian Gulf’s fossil fuels are located underneath Shiites. This is true even in Sunni Saudi Arabia, where the major oil fields are in the Eastern Province, which has a majority Shiite population.
As a result, one of the Saudi royal family’s deepest fears is that one day Saudi Shiites will secede, with their oil, and ally with Shiite Iran.
.. Similar calculations were behind George H.W. Bush’s decision to stand by while Saddam Hussein used chemical weapons in 1991 to put down an insurrection by Iraqi Shiites at the end of the Gulf War. As New York Timescolumnist Thomas Friedman explained at the time, Saddam had “held Iraq together, much to the satisfaction of the American allies Turkey and Saudi Arabia.”
Reporters without Borders: Country Ranking
The degree of freedom available to journalists in 180 countries is determined by pooling the responses of experts to a questionnaire devised by RSF. This qualitative analysis is combined with quantitative data on abuses and acts of violence against journalists during the period evaluated. The criteria evaluated in the questionnaire are pluralism, media independence, media environment and self-censorship, legislative framework, transparency, and the quality of the infrastructure that supports the production of news and information.
1 / Pluralism [indicator scorePlur]
Measures the degree to which opinions are represented in the media.
2/ Media independence [indicator scoreInd]
Measures the degree to which the media are able to function independently of sources of political, governmental, business and religious power and influence.
3/ Environment and self-censorship [indicator scoreEA]
Analyses the environment in which news and information providers operate.
4/ Legislative framework [indicator scoreCL]
Measures the impact of the legislative framework governing news and information activities.
5/ Transparency [indicator scoreTra]
Measures the transparency of the institutions and procedures that affect the production of news and information.
6/ Infrastructure [indicator scoreInf]
Measures the quality of the infrastructure that supports the production of news and information.
A seventh indicator based on data gathered about abuses and acts of violence against journalists and media during the period evaluated is also factored into the calculation.
7/ Abuses [indicator scoreExa]
Measures the level of abuses and violence.
Each indicator is given a score between 0 and 100.
Live CO2 emissions of the European electricity production
Live CO2 emissions of the European electricity production